Tracking campaign performance and sifting through an array of metrics is an essential part of any marketer’s daily routine. So, it is no surprise that when Google announced the release of its new analytics platform Google Analytics 4 (GA4), and the eventual discontinuation of Universal Analytics (UA), the digital marketing world reacted with both excitement and caution. For those of us not familiar with GA4, the DMI guide to GA4 gives a complete overview of the platform.
While GA4 promises a lot of interesting new features and updates to those found in UA, the reporting dashboard and reports have fundamentally changed. Essentially, while Universal Analytics provided users with a set of predefined reports, GA4 offers fewer predefined reports, but a far greater ability to create your own reports based on your specific needs. And as the navigation has changed so much from UA, one of the biggest challenges of adapting to GA4 for many is not being able to find their reports!
The reporting interface is very different in GA4 compared to Universal Analytics so it’s important to know where you should look for your data. GA4 breaks the reports down into two broad categories: Lifecycle and User reports and it may not be immediately apparent where the equivalent reports you’re familiar with in Universal Analytics are.
You can also check out our other GA4 detailed guides here, so, when Google shuts down UA, you'll be ready to hit the ground running with GA4.
GA4 reports
The navigation to the reports in Universal Analytics is typically through the reports menu on the left-hand side. In GA4 it’s done through the overview section followed by a click into a specific report widget. Once you familiarize yourself with the new navigation type, it will make using GA4 a lot easier.
User reports (UA) in GA4
The user reports in Universal Analytics tell us about the characteristics of our website visitors, where they are located, what devices they use, and their demographics. If you are looking for this data in GA4 you’ll find it in the following locations:
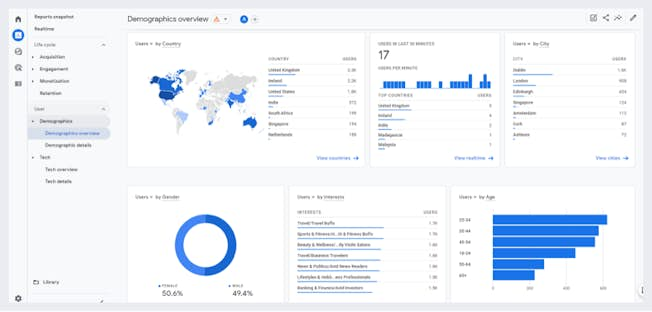
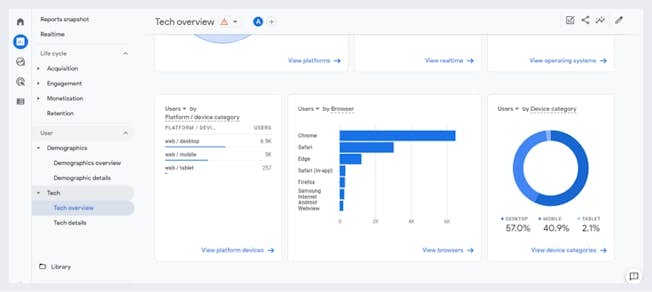
And you can use the following table as your cheat sheet for finding UA user reports reports in GA4

Acquisition reports (UA) in GA4
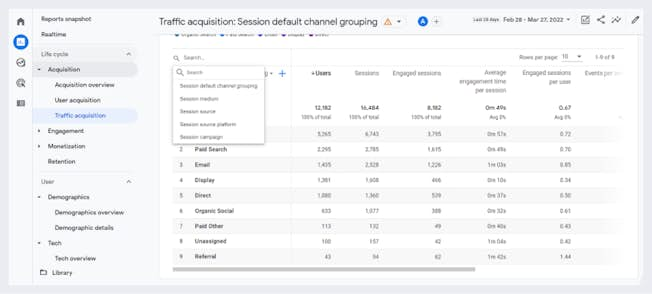
As a digital marketer we spend a lot of time analyzing the traffic to our site and what channel and campaigns it came from: this is how we report on performance. GA4 also shows us how people originally found our site with new reports like User Acquisition and User Acquisition: First User Medium. The First User Medium is mainly for campaign traffic and shows you the traffic medium, such as email, CPC, organic (search) to show how people find the site. The User Acquisition report is similar to the First User medium report and allows you to see all Default Channels, not just the campaign traffic that first brought people to the site.
These new reports are useful for trying to show the effect of top of funnel activity that brings prospective customers on to your website to do their initial browsing. Universal Analytics didn’t show us this data, as it was measuring site traffic or sessions; it would show us user totals but not how they first visited the site. While there was some first user touchpoint data in the multichannel funnels report in Universal Analytics, the GA4 first user acquisition reports are a lot more robust for showing you the channels that introduce your website to your audience. Knowing this allows you to plan more effective new customer acquisition campaigns.
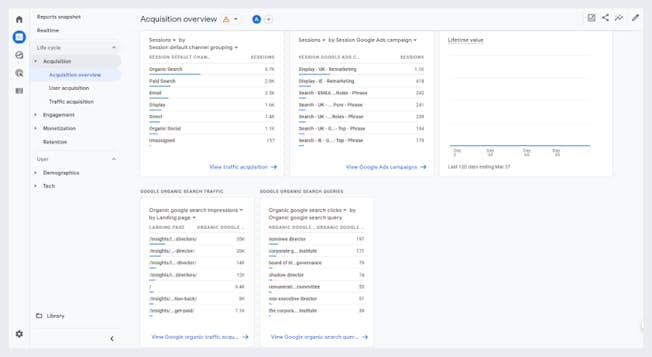
To find some of the acquisition reports from Universal Analytics in GA4 you can find them in the following locations:
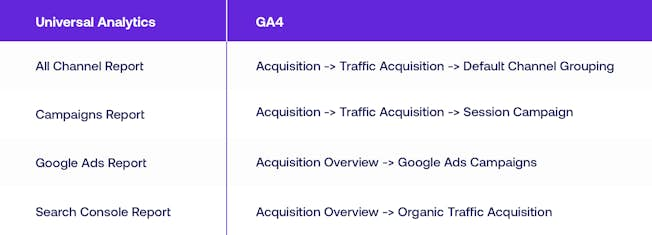
To get the data you want you might need to toggle your dimensions to the data segment you want to analyze. To do this, simply click on the dimension dropdown in the top left of the report above your rows.
Behavior reports
The behavior reports in Universal Analytics allowed us to look at our site content to see what pages people are visiting. GA4 unifies website pages and app screens into one reporting area called “Pages and Screens” which is found in the Engagement section of GA4. You can also report on all page interaction events in the Engagement section to see what interactions people are having with your website to help you understand your conversions and customer journey better.
This is where you can find some of the most common Universal Analytics Behavior Reports in GA4:

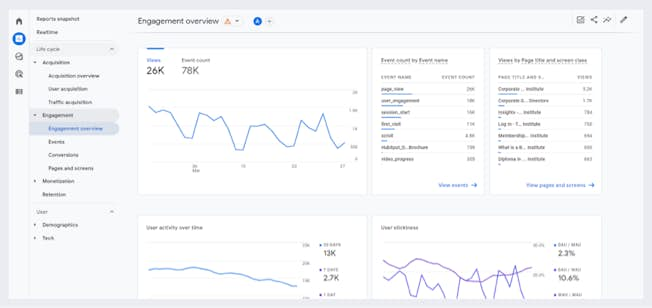
Other reports in Universal Analytics, such as landing and exit pages, need to be defined as events in GA4 to track effectively. However, we can add a secondary dimension to the User Acquisition reports to quickly see our top landing pages for new visitors to the site.
Conversion reports
One of the most valuable aspects of Universal Analytics was to track the valuable actions people took on our website, like making a purchase or filling out a lead form. These valuable actions were known as Goals in Universal Analytics and are called Conversions in GA4.
While this Universal Analytics data was most useful when viewed in terms of the channels, devices and locations etc. that drive these goals, there was an overview section where we could see our totals over time to help us spot trends etc.
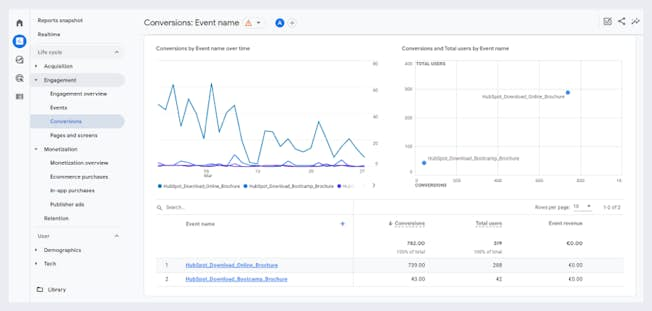
As mentioned in the setup section, tracking goals in GA4 is based on events that are created automatically by the GA4 system. However, you can create your own events and conversions that are specific to your website and business like the destination URL example earlier or created specifically for non-standard page interactions using tools like Google Tag Manager. Once these events are registering in GA4 we can make them as conversions and, as in Universal Analytics, see which channels, campaigns, locations, and devices etc. drive most conversions. With this data we can put more focus on the campaigns, keywords etc. that drive most conversions and de-prioritize campaigns that are less effective by spending less time or money on them.
Conversion metrics are available in all Acquisition and User reports and a summary of all conversions can be seen in the Engagement -> Conversions Report.
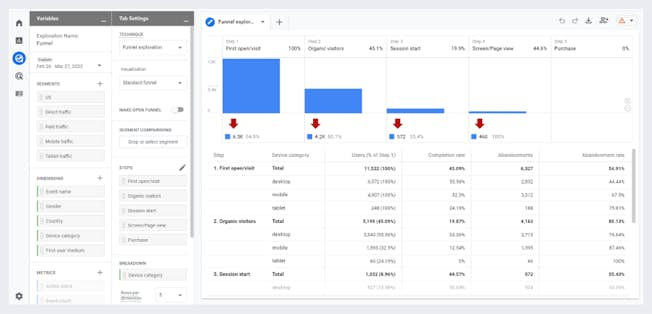
While it was very straightforward to create a goal funnel report in Universal Analytics it was mainly useful for reporting on people moving through an ecommerce checkout: it didn’t report so effectively on the smaller interactions across your website. Even though the behavior flow reports attempted to show the pages that people visited and dropped off as they moved through your website, it didn’t effectively link up with the goals you were recording.
However, the Funnel or Path Exploration reports in GA4 will show pages and paths to conversion that take events and page interactions into account: not just visits to a web page, but what people do on those webpages. For advanced users, it’s worth setting up these reports to map your customer journey and touch points through your website and mobile app but if you’re just getting started with GA4, leave these reports for the moment until you get familiar with the other reports mentioned above.
Ecommerce reports
Just like Goal reports, ecommerce data in Universal Analytics allowed you to see which campaigns, channels, keywords, email shots, devices, and locations drove most revenue for an ecommerce website. This functionality is also available in GA4 and can be seen in the Monetization -> Ecommerce Purchases reports.
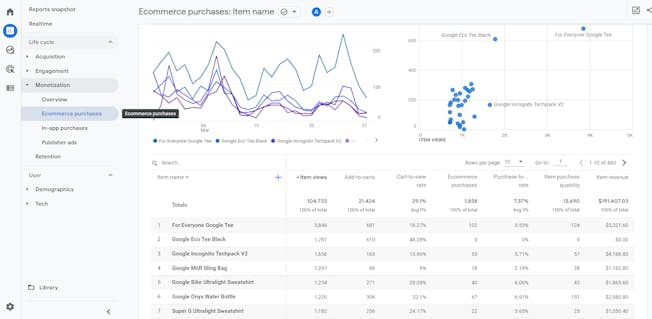
Where applicable for businesses that use mobile apps to sell online, you can see in-app sales and revenue for things like subscription upgrades and other gaming purchases alongside your website data.
Multichannel funnel reports
One of the later additions to Universal Analytics was the ability to look at the different touchpoints that lead to a goal completion or ecommerce transaction. This functionality is also available in GA4 and can be found in the Advertise Section in the left hand menu. There you can view your conversion paths which show the different channel journeys that lead to a conversion on your website.
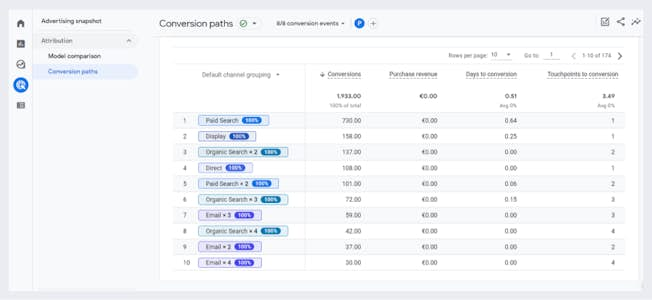
Even though the reporting engine is vastly different between Universal Analytics and GA4, much of the reporting functionality is available in GA4. It’s just named slightly differently, or the navigation is through the overview section rather than directly through the left hand navigation.
Comparisons, filters, and segments
As you get familiar with the reporting in GA4, there might be times when you want to focus further on specific data points. In Universal Analytics, you might add a filter at the property or view level or a custom segment to put a temporary filter over the data for comparison purposes. In GA4 it’s also possible to filter traffic at the property level, though options are limited compared to Universal Analytics.
Likewise, it’s possible to add a temporary filter, similar to a custom segment in Universal Analytics simply by pressing the comparison button at the top of any report, then setting the conditions for the data you want to focus on.
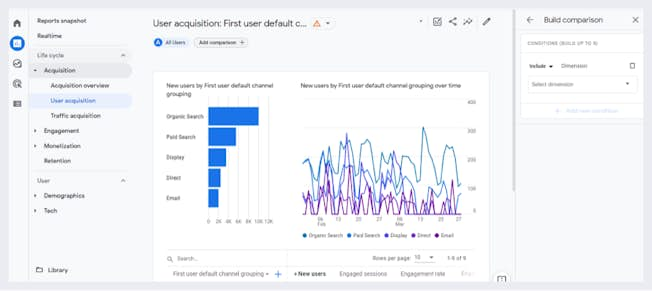
Deep diving and interrogating data using comparisons is a great way to spot opportunities and trends in larger data sets. So when you spot a change at a high level or have a hypothesis about certain data segments, you can create a filter to focus only on these numbers and you can make a decision based on the results.
The experts are clear - you need to get GA4 set up immediately to run in parallel with Universal Analytics, and now is the right time to familiarize yourself and your staff with how reports work in GA4. As co-founder and chief data scientist at Trust Insights Chris Penn said on our recent podcast, missing data and reports could lead your overall data to become ‘spoiled’ or simply ‘out of date’. You can also find out more about the differences between UA and GA4 at our GA4 Team Talk. And if you haven't already set up GA4 on your website, here is our detailed guide to setting up GA4.
Related
Upgrade to Power Membership to continue
your access to thousands of articles, toolkits, podcasts, lessons and much much more.
Become a Power Member- Login
- View Courses
- - - -
- Courses
- Resources
- - - -
- My Account
- Change Password
- Logout


