Twitter offers people a way to keep up with events and happenings across the world in real-time. It also encourages conversation and engagement in a way that can drive connections and build trust. It’s still a popular channel even in the age of going viral on TikTok.
For brands, Twitter can be a great marketing channel when used in the right way. Plus it's popular amongst internet users between 16 and 64 years of age who rank Twitter as their 7th favorite social media platform according to ‘The Global State of Digital 2022’.
To drive engagement and measure the performance of organic and paid posts, it’s crucial to know how to use Twitter analytics. In this blog, we look at six effective ways to use the platform’s analytics to boost engagement and brand awareness.
What is Twitter Analytics?
Twitter analytics is a way for you to analyze your tweet data to gain insight into your content and followers.
It will show you how your audience is responding to your content (and content formats), what's working, and what's not using a variety of specific metrics (described below). You can then use this data and insights to optimize your Twitter posts and campaigns to get better results.
Where to find Twitter Analytics
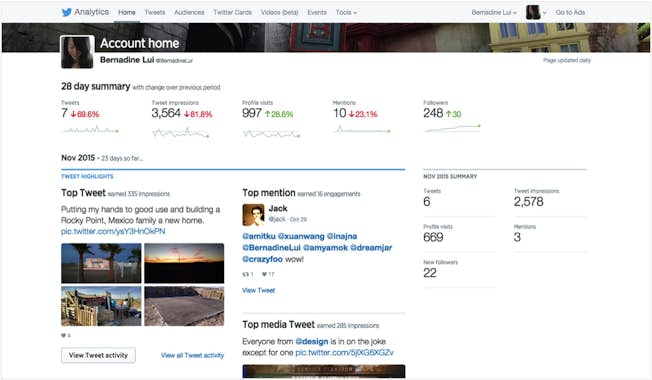
Within the Twitter platform, Account home is the place to go for your data but you can access your Tweet Activity Dashboard and Video Activity Dashboard by selecting the ‘Tweets’ tab in the header.
In Account home, you can see a summary of your account activity and highlights of your top Tweets, mentions, and followers for any month. You can also access detailed information on account performance, how far you’ve progressed, and tips on how to improve your strategy.
Twitter Analytics is also your best option for managing your Twitter paid advertising and ensuring it’s performing as it should.
What Twitter Metrics are There?
Like any social network, you need to understand what metrics are available and what ones matter to your brand on Twitter. There are many metrics you can measure, so let’s look at what’s on the platform:
- Tweets: This is the number of times you tweeted
- Tweet impressions: This is the number of times people are shown your Tweet in their timeline, search results, or from your profile
- Profile visits: This is the number of times people have visited your profile
- Mentions: This refers to the number of times your @handle was mentioned in Tweets
- New followers: This is the total of new followers you have gained
- Tweets linking to you: This is the number of times your Twitter Card(s) was tweeted by you and/or other people
There are also top-performing metrics you can look at to draw insights:
- Top Tweet: This is the Tweet that has received the highest number of impressions
- Top media Tweet: This is the Tweet that includes a photo or video that received the highest number of impressions
- Top Card Tweet: A Tweet with a Twitter Card (a multimedia addition to Tweets that can grab attention in the feed using an image or video) that received the highest number of impressions and can include other people’s Tweets

- Top mention: This is a Tweet that included your @handle and received the highest number of impressions
- Top follower: This is the account with the highest follower count that followed you
You can select ‘View Tweet details’ to learn more information about a specific Tweet or select ‘View follower’ to get more information about your top follower.
What Key Twitter Metrics Should You Measure?
You will only know the performance of your organic and paid Twitter posts by tracking metrics. Set Key Performance Indicators, otherwise known as KPIs, to track the metrics that are important for your business.
For example, conversions may be the top KPI for an ecommerce business while a brick-and-mortar retailer may value retweets for brand awareness.
Key Account Metrics
Engagements
The number of users who retweeted, replied or liked your tweet. These interactions demonstrate a desire to find out more, share your tweet with others, or otherwise engage with you. It may be a leading indicator of a call-to-action that is working well.
Engagement rate
This number reflects engagements divided by the number of impressions. Let's say a tweet went out at a bad time of day (see our post on the best times to post on Twitter to avoid this!), and only ten people saw it (ten impressions), but eight of them engaged with it. That could be a sign of content that performs better than a tweet that was seen by 100 people and got eight engagements.
Follower growth
This number reflects the number of new followers you have gained over 30 days. It is a great indicator of your content resonating and a growth in brand awareness. If you pair this metric with engagement it will show you if the followers you are gaining are of quality and not just quantity.
Key Ad Metrics
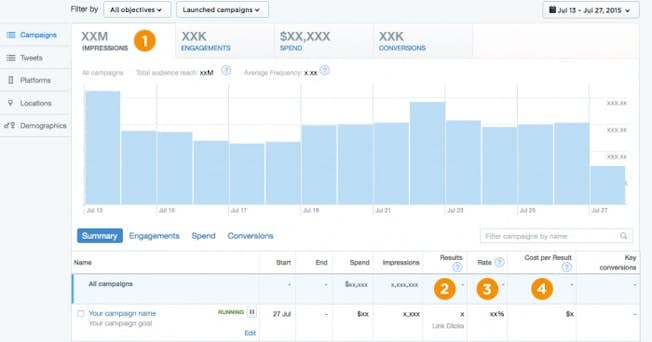
Cost per result/engagement
This metric is the average cost per action (CPA) taken by a user upon seeing your ad. Your campaign only gets charged when a user takes one of your desired actions. The cost per result is useful for managing your budget and measuring your return on investment.
Key conversions
Key conversions track the actions starting from your Twitter ad and finishing on your website. It provides a view of the path taken by a user to ultimately complete a transaction on your site. With its ability to dig deeper into post-engagement, conversions, transaction values, and total sales, it's the best metric for measuring ROI.
Results or Return on Investment (ROI)
Results are the number of desired actions generated by your ad. They can include engagements, video views, clicks, and conversions, among others. That is what you need to know to find out if your ad is achieving the campaign objectives and giving you a good ROI. The results rate is the number of results received divided by the number of impressions earned by the ad. To track ROI make sure you have conversion tracking set up.
Now you know more about the workings of Twitter Analytics, let’s look at 6 ways to use it effectively to drive engagement and performance.
1) Get to Know Your Followers
You can’t be expected to create compelling and meaningful content for an audience if you don’t know anything about them. You can start with the basics by finding out about their social media demographic information (gender, age, language, income, and location), and their unique interests.
You can then compare your demographic data against the general Twitter data, to see how your audience differs.
Follower data is found on your dashboard. Here, you can also target your audience based on their preferred device, behavior, and interests. You can also find followers of similar accounts who may be interested in following you.
These insights can even be used to create a follower campaign to grow your base. For example, pain relief producer Tiger Balm created an ad specifically to prompt people to follow them on Twitter.

2) What Tweets Are Working?
Twitter analytics allows you to determine which topics elicit the most engagements. Engagements on Twitter include follows, retweets, favorites, replies, URL clicks, media views, hashtag clicks, and mention clicks.
You will find impressions, engagements, and engagement rates on the Tweets tab. If you keep an eye on which tweets are achieving the most engagements over time, you’ll be able to target your content accordingly and develop a closer connection with your followers.
In 2021, Twitter announced its ‘Best of Tweets’, and one of the stand-out ‘most tweeted about brands’ was the innovator and magic creator Disney. The reason? Sharing a variety of content types and creating hype around new releases across its channels.

3) Know When to Tweet
When it comes to Twitter, different days and times get more engagement than others. So it’s important to try a variety of posting days and times to see what drives engagement for you. See our guide to the best times to post on Twitter.
Geographic data can also inform the best time to post specific content. Twitter can analyze your data to suggest the optimal time to post for the best possible engagement.
However, don't let the optimal day and time to tweet dictate your frequency. It's still a good idea to post at least once a day and to keep the volume of tweets more or less steady, so your audience can become accustomed to the frequency of your posts.
4) Make the most of TweetDeck
TweetDeck is perfect for big brands or those with a few Twitter accounts as it lets you view multiple timelines in one easy interface. It uses customizable columns to let you see lots of information in one place such as your main timeline, notifications, scheduled tweets, direct messages, etc.
This feature is perfect for social media managers or anyone dealing with social media accounts as you can use it to track multiple topics at once to stay informed, get alerts for breaking news, monitor your brand voice, schedule Tweets and find real-time content quickly.
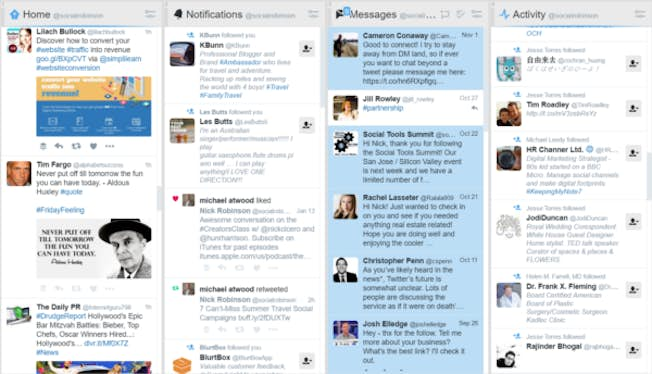
Just go to TweetDeck and the default columns will be ‘Home’, ‘Notifications’, ‘Messages’ and ‘Trending’. You can add or remove columns using the + icon. You can also compose or send tweets and search.
This feature will help you to keep track of all the important interactions and news in one place. That way you can keep on top of trends and ensure you are responding to any direct messages from customers.
5) Measure the Performance of Your Ads
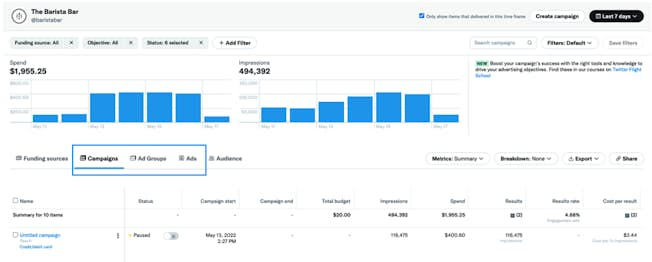
When you invest money in Twitter advertising, be it in an ad campaign or by boosting posts, you want to compare ad performance against your regular posts.
You can do this on Twitter at the top right of the Tweets tab which provides a glimpse of your paid and organic posts. Get more detailed information by hovering over any given spot on the graph.
Below that, you can click on ‘promoted’ to zoom in on your paid posts to see how they performed from an impression and engagement point of view. Note that this data is not kept forever so be sure to download your data if you want to keep a longer-term performance record.
Read our blog ‘Walkthrough: Twitter Ads with Cathal Melinn’ to find out more about advertising on Twitter.
6) Repeat Your Successes
If you look at the most popular tweet of all time, number one is billionaire Japanese entrepreneur Yusaku Maezawa who offered 1 billion yen (equalling $9.1 million) to 1,000 people who followed and retweeted. His tweet resulted (unsurprisingly) in 4.1 million retweets, a record to date.

No doubt you don’t have access to that kind of incentive but by using Twitter analytics regularly, you'll soon see what strategies work best and which ones can be dropped.
For example, do you get different interactions based on the tone and language used in your best-performing tweets? What is your top hashtag or tweet featuring a video or Tweet Card? Are there different days or times that work or call-to-actions that get more reactions?
Use any insights from Twitter analytics to craft the content for your upcoming tweets and for scheduling them.
Understand your Data to Drive Engagement on Twitter
Twitter offers marketers a unique opportunity to engage with prospects and customers. Become a Social Media Marketing Specialist by understanding the fundamentals along with the nuances of each platform from Twitter to YouTube to WhatsApp to TikTok. Enroll in DMI’s Social Media Marketing course today to get the most from your organic and paid social media activities.
Related
- Categories:
- Articles
- Social Media Marketing
- Data and Analytics
Upgrade to Power Membership to continue
your access to thousands of articles, toolkits, podcasts, lessons and much much more.
Become a Power Member- Login
- View Courses
- - - -
- Courses
- Resources
- - - -
- My Account
- Change Password
- Logout


